Does anyone know?
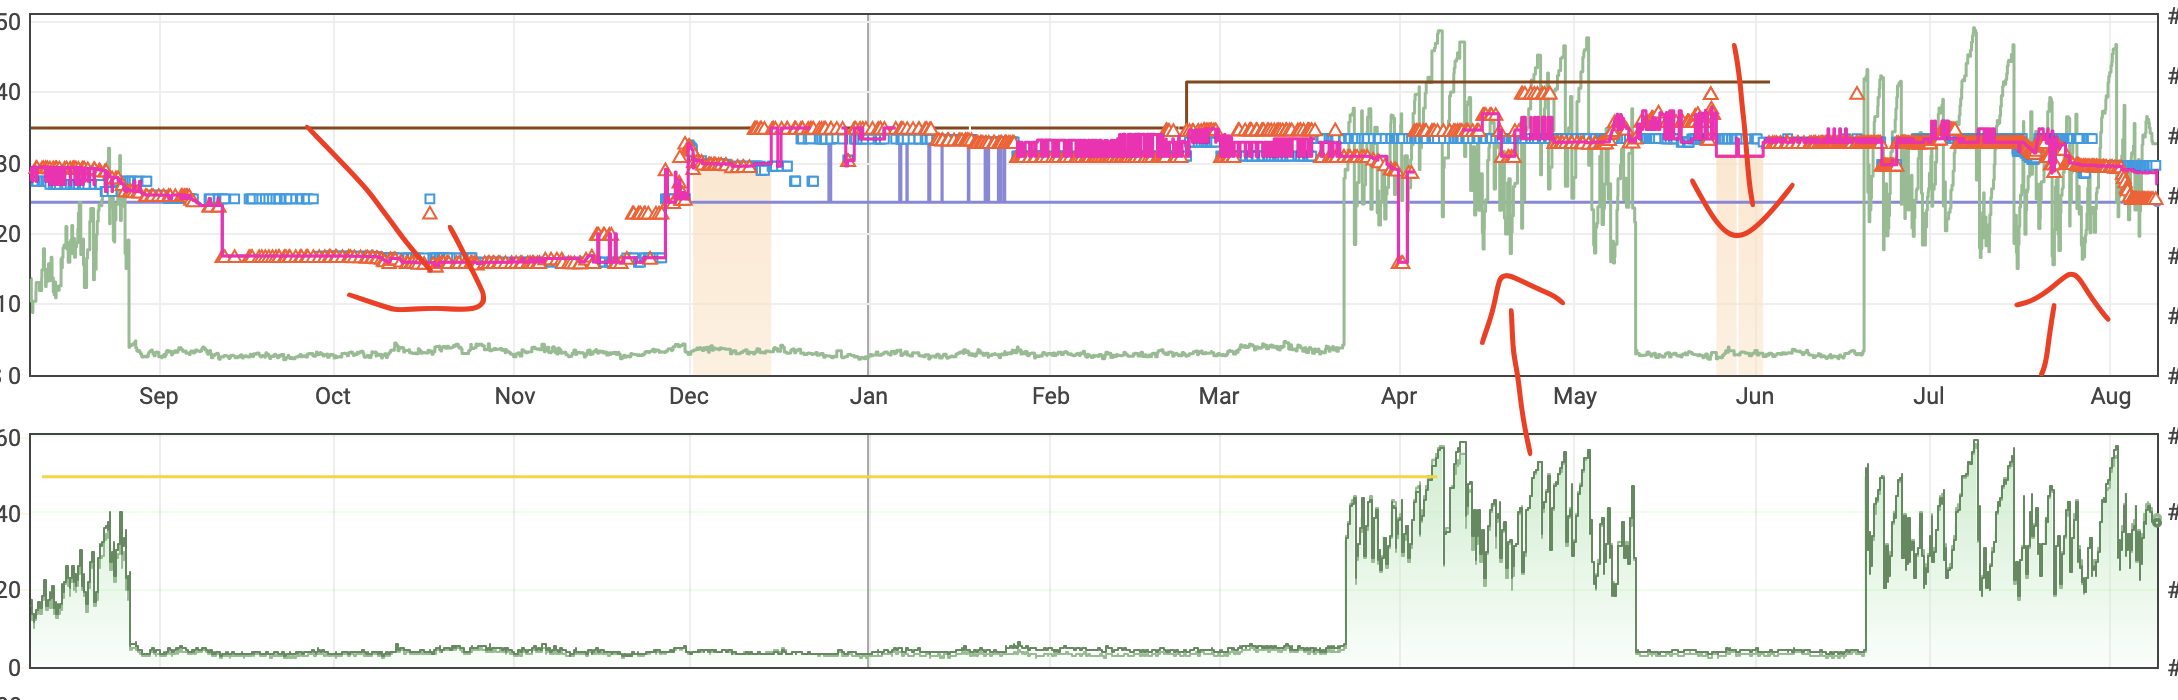
The graph shows the merging and unmerging of variations. However, the sudden drop and rise in BSR is due to the best-selling variation occasionally going out of stock. When it becomes available again, it quickly drives up sales.
Sales increase when the BB price is reduced and when Amazon jumps on the listing. When the BB price increased, BSR also increased as the number of sales decreased. This is just a guess—I don’t think it’s that deep.