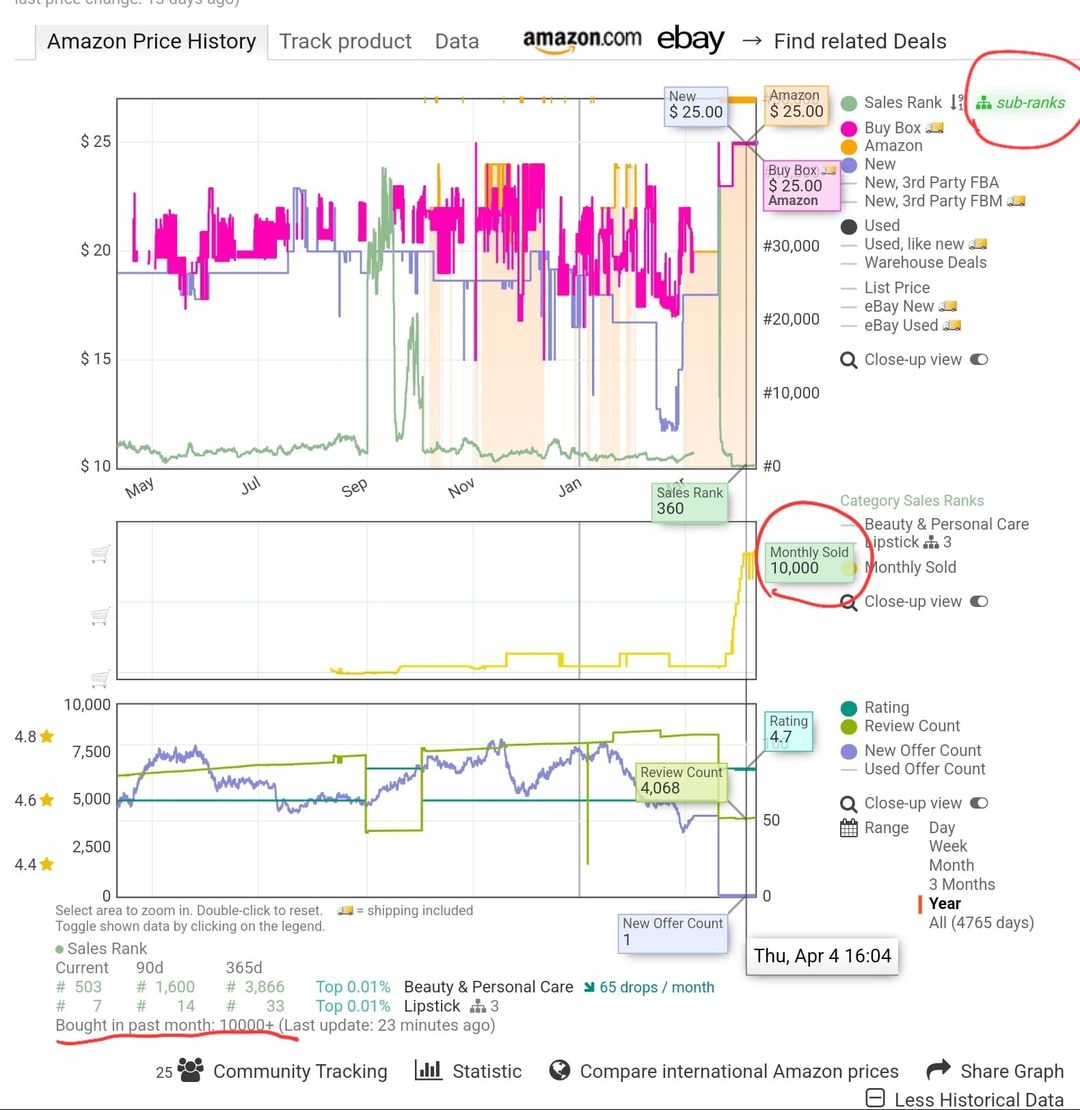
There is a new yellow line in the middle graph that tracks the estimated monthly sold. Amazon introduced “Sold in Past Month” before Q4 of last year. Now, Keepa has a graph to track this metric.
Click the sub-ranks button in the top right to enable/disable the middle graph.
This metric is tier based (50+, 100+, 200+, etc.) but is pulled directly from the Amazon listing. This will be great for tracking seasonal trends among other uses.
*Bonus: This is what an IP complaint looks like in Keepa (see new offer count on bottom graph).
Good feature, however it’s a very loose reference. Keepa, when it comes to units sold is very very inaccurate and used to manipulate listings and ranks. Nevertheless, all data is just a reference point not factual.
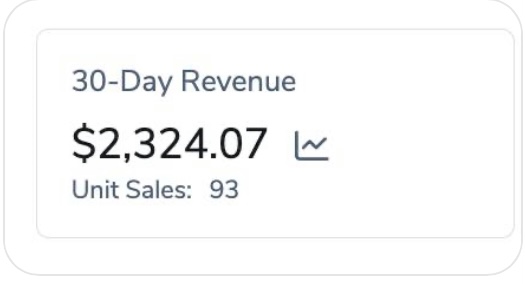
I have checked a random listing ( never sold on this one so i dont have real data) but keepa is showing 100 sales pm and in the last month only 50, and h10 is showing 93 sales in the past 30 days…