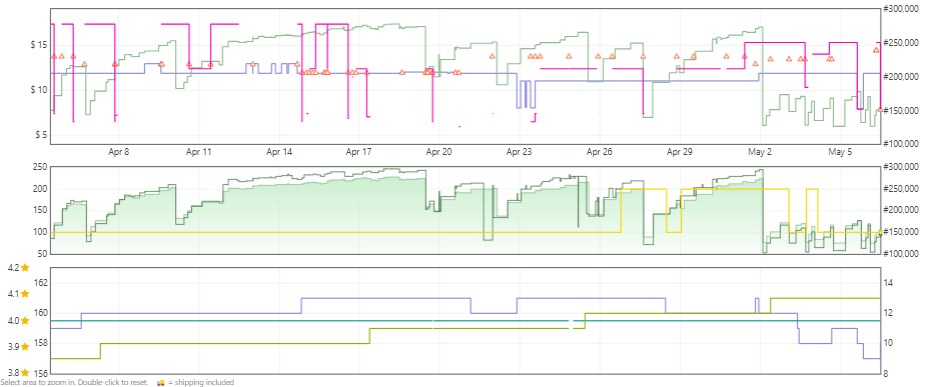
Take a look at this listing’s Keepa graph. The timeframe is the last 30 days. It is not a variation. The BR drops are only 15 (top chart green line) but the monthly sold is 100-200+ (middle chart yellow line) and also shows 100+ bought in past month on the listing itself. Only a few 3rd party sellers (bottom chart).
By the way; I’ve already tested this listing and know the actual sales velocity, but I want to hear what others are thinking.
A single drop doesn’t refer to only one unit sold, it could be more than that.
About the sales, if we consider the whole month’s graph, clearly it wasn’t selling the whole month, the number of units was mainly sold after the 2nd of May and it is selling more at the end of the month as compared to the whole month.
About the velocity, it’s still not good but got better after 2nd May if we compare it with the whole month. The reason I’m saying this is because if we look at the new offer count, the sellers aren’t going OOS but some of them went after the 2nd May due to comparatively better sellers I say.
Overall, there are other factors as well which should be taken under consideration before drawing a conclusion. For further confirmation, we need to check the offers section for individual sellers.